Page 1 of 1
Download
Get this sheet
SubscriptionOpen any sheet in any course, up to 40 a month, keys included. Or $40 month to month.
$25/mo, billed yearly
SubscribeTry one first: a free Chapter 1 worksheet (PDF, no sign-in).
What's on the worksheet
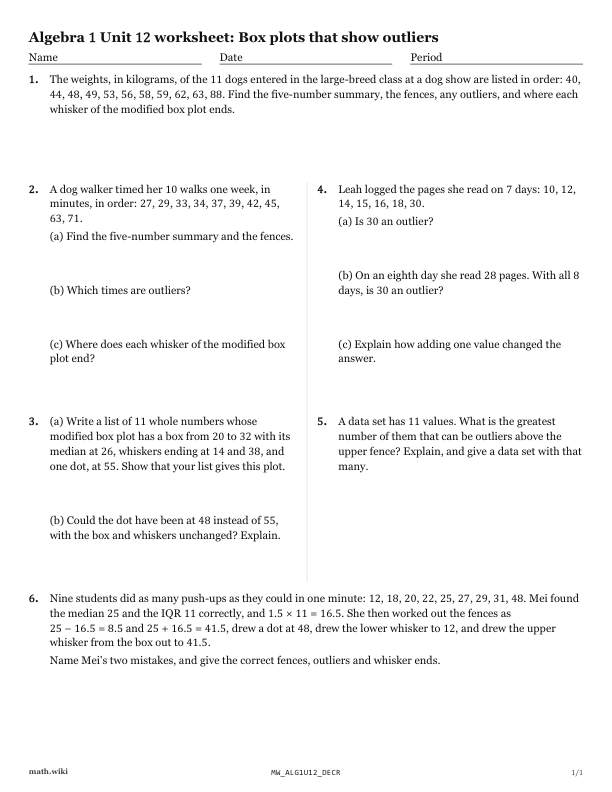
- Dog show weights: find the five-number summary, fences and any outliers.
- Dog walker's walks: find the summary and draw the modified box plot.
- Write a list of 11 whole numbers that matches a described modified box plot.
- Leah's pages read: test whether 30 is an outlier and what a new day does.
- Decide how many values can be outliers above the upper fence, and give an example.
- Check Mei's median and IQR for the push-ups data and find outliers.
Teach it first
The free lesson teaches it with worked examples and practice problems.
Box plots that show outliers: the lesson ›More Chapter 12 worksheets: One-variable statistics
- 12.1Relative frequency histograms
- 12.2Percentiles
- 12.3Box plots that show outliers
- 12.4Variance of a data set
- 12.5Computing a standard deviation, sample and population
- 12.6Interpreting a standard deviation
- 12.7Shifting and rescaling a data set