Page 1 of 2
Download
Get this sheet
SubscriptionOpen any sheet in any course, up to 40 a month, keys included. Or $40 month to month.
$25/mo, billed yearly
SubscribeTry one first: a free Chapter 1 worksheet (PDF, no sign-in).
What's on the worksheet
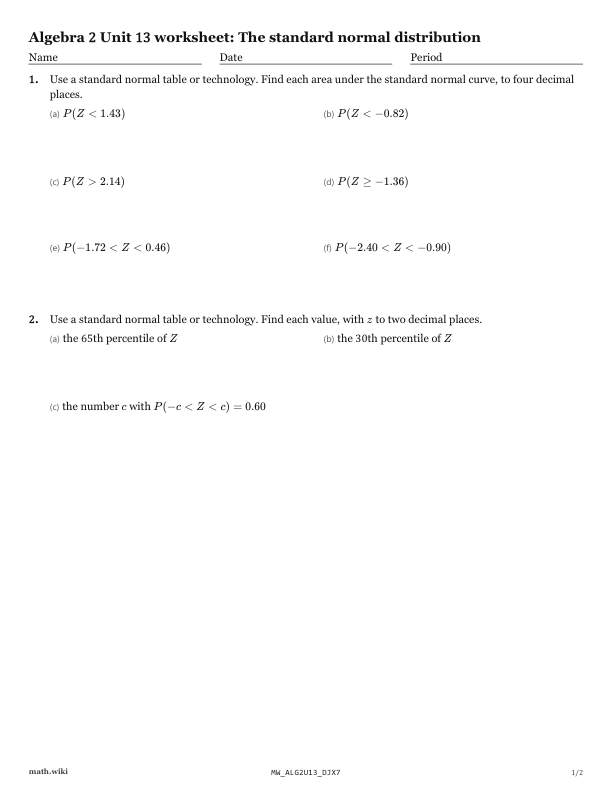
- Find each area under the standard normal curve, to four decimal places.P(Z < 1.43)P(Z < -0.82)P(Z > 2.14)P(Z \geq -1.36)P(-1.72 < Z < 0.46)
- Find the z value for each percentile.the 65th percentile of Zthe 30th percentile of Zthe number c with P(-c < Z < c) = 0.60
- Find the areas of the two shaded regions in the figure.
- Convert between a table that lists area from 0 and one that lists area to the left.
- Find Layla's mistake in finding an area between two z values.
- Find a number a for which the area between a and 1.10 is one half.
Teach it first
The free lesson teaches it with worked examples and practice problems.
The standard normal distribution: the lesson ›More Chapter 13 worksheets: The normal distribution and introductory inference
- 13.1Density curves: area, mean and median
- 13.2The normal distribution
- 13.3z-scores and the empirical rule
- 13.4Standardizing a data set
- 13.5The standard normal distribution
- 13.6Normal calculations: areas and percentiles
- 13.7Checking whether data look normal
- 13.8Simulating a sampling distribution and a margin of error
- 13.9Comparing two treatments by re-randomizing