Page 1 of 2
Download
Get this sheet
SubscriptionOpen any sheet in any course, up to 40 a month, keys included. Or $40 month to month.
$25/mo, billed yearly
SubscribeTry one first: a free Chapter 1 worksheet (PDF, no sign-in).
What's on the worksheet
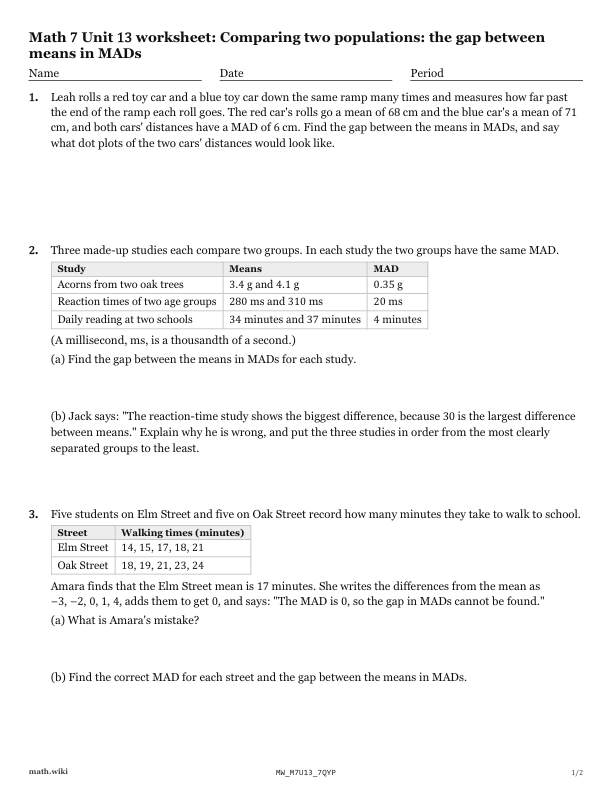
- Compare the mean distances of Leah's red and blue toy cars in MADs.
- Compare the gap between means in MADs for three studies.
- Compare walking times to school on Elm Street and Oak Street.
- Compare how far two species of snail crawl using dot plots.
- Compare waiting times at two food trucks using their means and MAD.
Teach it first
The free lesson teaches it with worked examples and practice problems.
Comparing two populations: the gap between means in MADs: the lesson ›More Chapter 13 worksheets: Sampling and comparing populations
- 13.1Populations, samples and census
- 13.2Convenience and voluntary response samples
- 13.3Response bias and question wording
- 13.4Simple random samples and the sampling frame
- 13.5Parameters and statistics
- 13.6Sampling variability and simulating it
- 13.7Comparing box plots
- 13.8Comparing two distributions
- 13.9Comparing two populations: the gap between means in MADs