Page 1 of 3
Download
Get this sheet
SubscriptionOpen any sheet in any course, up to 40 a month, keys included. Or $40 month to month.
$25/mo, billed yearly
SubscribeTry one first: a free Chapter 1 worksheet (PDF, no sign-in).
What's on the worksheet
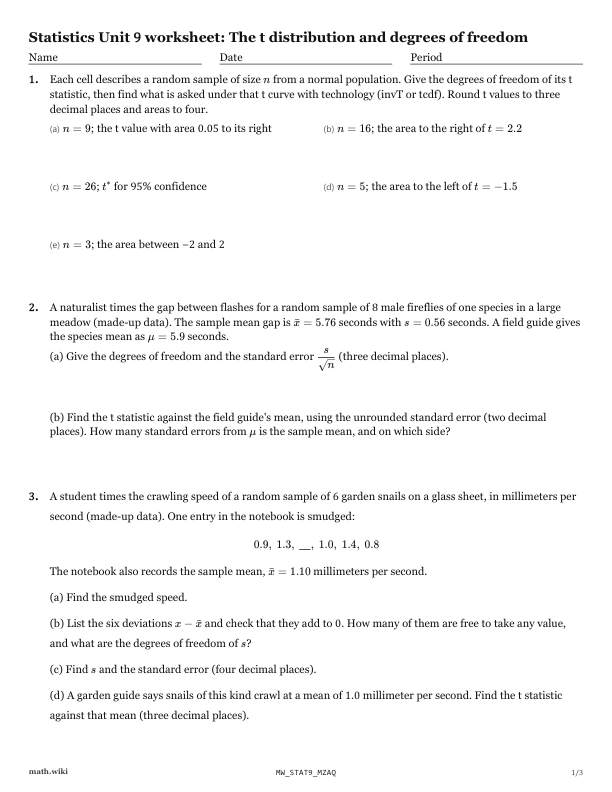
- Each cell describes a random sample of size n from a normal population.n = 9; the t value with area 0.05 to its rightn = 16; the area to the right of t = 2.2n = 26; t^* for 95% confidencen = 5; the area to the left of t = -1.5n = 3; the area between −2 and 2
- A naturalist times the gap between flashes for a random sample of 8 male fireflies of one species in a large meadow (made-up data).
- A student times the crawling speed of a random sample of 6 garden snails on a glass sheet, in millimeters per second (made-up data).
- Here is the row of a t table for df = 12.
- For df > 2 the standard deviation of the t distribution is √(df)df - 2.
- A printed t table has only these rows (two-sided confidence levels).
- Say whether a z or a t critical value applies for a 95% interval for the mean, and why.
Teach it first
The free lesson teaches it with worked examples and practice problems.
The t distribution and degrees of freedom: the lesson ›More Chapter 9 worksheets: Inference for means
- 9.1The t distribution and degrees of freedom
- 9.2Conditions for one mean
- 9.3One sample interval for a mean and sample size
- 9.4One sample test for a mean
- 9.5Interval for a difference of means
- 9.6Test for a difference of means
- 9.7Paired data: interval and test for a mean difference