Page 1 of 6
Download
Get this sheet
SubscriptionOpen any sheet in any course, up to 40 a month, keys included. Or $40 month to month.
$25/mo, billed yearly
SubscribeTry one first: a free Chapter 1 worksheet (PDF, no sign-in).
What's on the worksheet
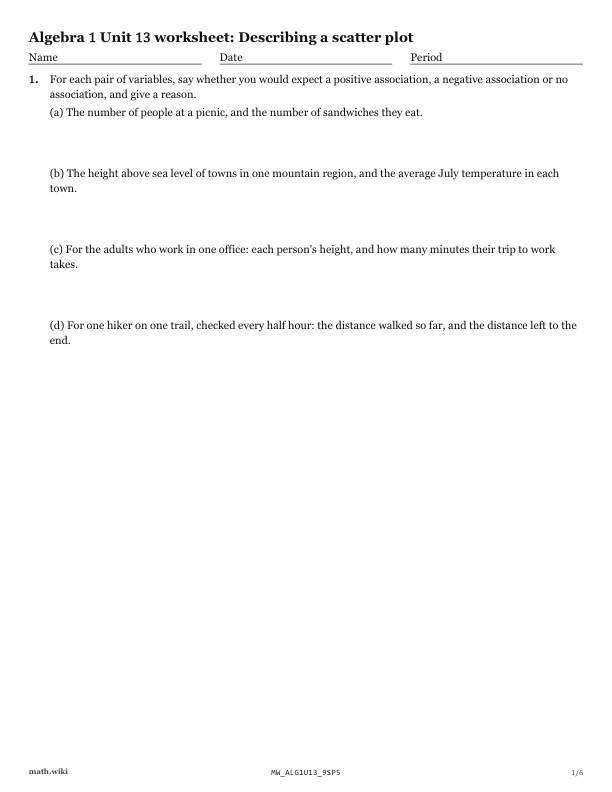
- Say whether to expect a positive, negative or no association for each pair of variables, and why.
- Paperback books: describe the association between pages and mass.
- Screen time and sleep: describe the scatter plot of twelve students.
- Cup of tea: describe the cooling pattern in the scatter plot.
- Swimming club: describe the association between age and 50 m time.
- Fire stations and house fires: explain a strong positive association across 20 towns.
Teach it first
The free lesson teaches it with worked examples and practice problems.
Describing a scatter plot: the lesson ›More Chapter 13 worksheets: Two-variable statistics
- 13.1Fitting linear and exponential models with technology
- 13.2Predicting with a regression line, and extrapolation
- 13.3Interpreting a residual
- 13.4Making and reading residual plots
- 13.5The correlation coefficient
- 13.6Properties of the correlation coefficient
- 13.7Observational studies and experiments
- 13.8Correlation is not causation: lurking and confounding variables
- 13.9Describing a scatter plot
- 13.10Line of best fit
- 13.11Conditional relative frequencies