Page 1 of 3
Download
Get this sheet
SubscriptionOpen any sheet in any course, up to 40 a month, keys included. Or $40 month to month.
$25/mo, billed yearly
SubscribeTry one first: a free Chapter 1 worksheet (PDF, no sign-in).
What's on the worksheet
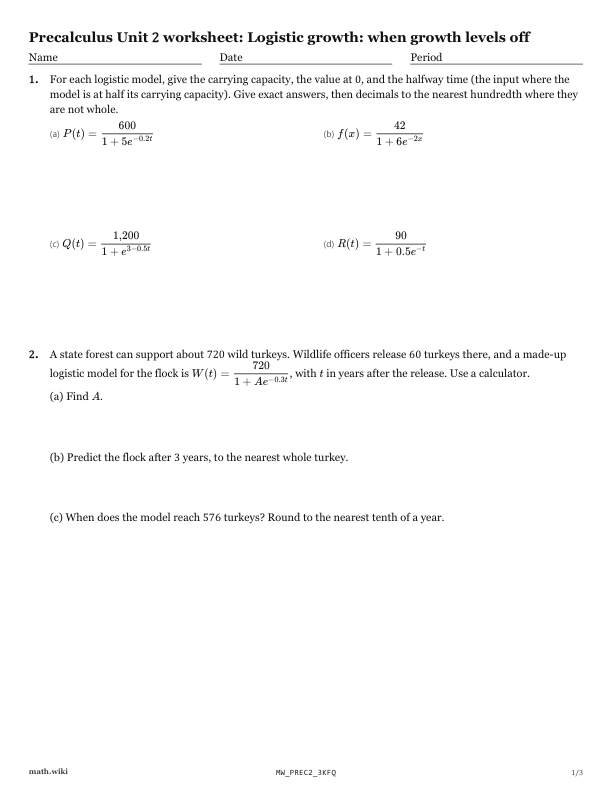
- For each logistic model, give the carrying capacity, the value at 0, and the halfway time (the input where the model is at half its carrying…P(t) = \dfrac{600}{1 + 5e^{-0.2t}}f(x) = \dfrac{42}{1 + 6e^{-2x}}Q(t) = \dfrac{1{,}200}{1 + e^{3 - 0.5t}}R(t) = \dfrac{90}{1 + 0.5e^{-t}}
- A state forest can support about 720 wild turkeys.
- White clover is spreading across a lawn of 800 square meters.
- The graph shows a made-up logistic model $N
- A town of 8,000 households starts curbside compost pickup.
- Beavers are returning to a river valley that can support about 180 of them.
Teach it first
The free lesson teaches it with worked examples and practice problems.
Logistic growth: when growth levels off: the lesson ›More Chapter 2 worksheets: Exponential and logarithmic modeling
- 2.1Graphs of logarithmic functions
- 2.2Laws of logarithms
- 2.3Solving by taking a logarithm of both sides
- 2.4Building an exponential model from two points
- 2.5Semi-log plots: straightening exponential data with logarithms
- 2.6Logistic growth: when growth levels off
- 2.7Judging and comparing models