Page 1 of 3
Download
Get this sheet
SubscriptionOpen any sheet in any course, up to 40 a month, keys included. Or $40 month to month.
$25/mo, billed yearly
SubscribeTry one first: a free Chapter 1 worksheet (PDF, no sign-in).
What's on the worksheet
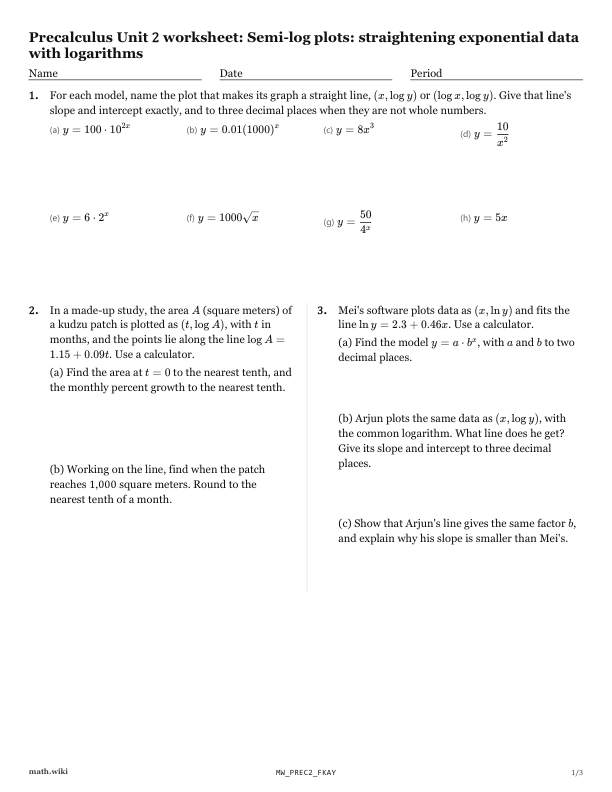
- For each model, name the plot that makes its graph a straight line, (x, y) or ( x, y).y = 100 \cdot 10^{2x}y = 0.01(1000)^xy = 8x^3y = \dfrac{10}{x^2}y = 6 \cdot 2^x
- In a made-up study, the area A (square meters) of a kudzu patch is plotted as (t, A), with t in months, and the points lie along the line A = 1.15 +…
- Mei's software plots data as (x, y) and fits the line y = 2.3 + 0.46x.
- In a made-up fit to data on mammals at rest, a plot of ( M, H), with M the body mass in kilograms and H the heart rate in beats per minute, lies…
- Priya counts the mosquito larvae N in a rain barrel on the days she can check it (made-up data).
- Layla counts the water fleas N in a tank for 10 days (made-up data) and plots (t, N), with t in days.
Teach it first
The free lesson teaches it with worked examples and practice problems.
Semi-log plots: straightening exponential data with logarithms: the lesson ›More Chapter 2 worksheets: Exponential and logarithmic modeling
- 2.1Graphs of logarithmic functions
- 2.2Laws of logarithms
- 2.3Solving by taking a logarithm of both sides
- 2.4Building an exponential model from two points
- 2.5Semi-log plots: straightening exponential data with logarithms
- 2.6Logistic growth: when growth levels off
- 2.7Judging and comparing models