Page 1 of 3
Download, free
The full Statistics courseEvery lesson in teaching order, with over 390 printables.See the course ›What's on the worksheet
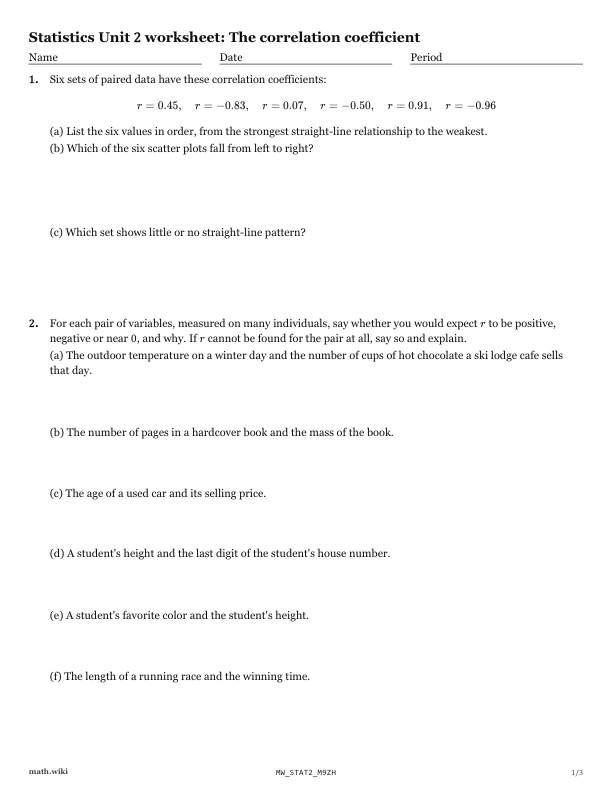
- Six sets of paired data have these correlation coefficients:
- For each pair of variables, measured on many individuals, say whether you would expect r to be positive, negative or near 0, and why.
- Without technology, decide for each data set whether r = 1, r = -1, r cannot be found, or none of these.(1, 7), (2, 5), (3, 3), (4, 1)(2, 4), (2, 6), (2, 9)(0, 3), (5, 13), (10, 23)(1, 2), (2, 4), (3, 8), (4, 16)(−2, 5), (0, 5), (3, 5)
- A library recorded, on five weekdays, the hours it was open and the number of books borrowed (made-up data), as pairs (hours, books):
- Two weather stations each recorded, on six summer days, the hours of sunshine and the highest temperature in degrees Celsius (made-up data), as…
- A town counted its public charging points for electric cars at the end of each year from 2016 to 2025.
Teach it first
The free lesson teaches it with worked examples and practice problems.
The correlation coefficient: the lesson ›More Chapter 2 worksheets: Exploring two-variable data
- 2.1Conditional relative frequencies
- 2.2Association in a two way table and segmented bar graphs
- 2.3Describing a scatter plot
- 2.4The correlation coefficient
- 2.5Interpreting a residual
- 2.6Making and reading residual plots
- 2.7Correlation from standardized values
- 2.8The least squares criterion and its line
- 2.9Slope from r and the spreads, and regression to the mean
- 2.10r squared and the standard deviation of the residuals
- 2.11Reading regression output
- 2.12Outliers, leverage and influential points
- 2.13Transforming to linearity: logs and exponential models
- 2.14Log-log transforms and power models