Page 1 of 6
Download
Get this sheet
SubscriptionOpen any sheet in any course, up to 40 a month, keys included. Or $40 month to month.
$25/mo, billed yearly
SubscribeTry one first: a free Chapter 1 worksheet (PDF, no sign-in).
What's on the worksheet
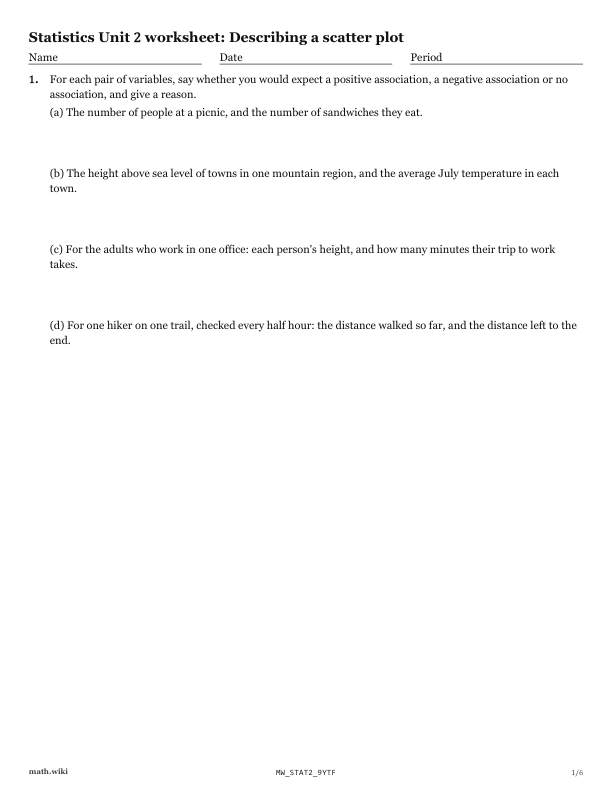
- For each pair of variables, say whether you would expect a positive association, a negative association or no association, and give a reason.
- A librarian weighed ten paperback books and counted their pages.
- Twelve students recorded their average screen time per day and their average sleep per night for one week.
- A cup of tea was poured and its temperature was measured every 2 minutes.
- A swimming club timed fourteen of its swimmers over 50 m.
- A study of 20 towns found a strong, positive association between the number of fire stations in a town and the number of house fires there each year.
Teach it first
The free lesson teaches it with worked examples and practice problems.
Describing a scatter plot: the lesson ›More Chapter 2 worksheets: Exploring two-variable data
- 2.1Conditional relative frequencies
- 2.2Association in a two way table and segmented bar graphs
- 2.3Describing a scatter plot
- 2.4The correlation coefficient
- 2.5Interpreting a residual
- 2.6Making and reading residual plots
- 2.7Correlation from standardized values
- 2.8The least squares criterion and its line
- 2.9Slope from r and the spreads, and regression to the mean
- 2.10r squared and the standard deviation of the residuals
- 2.11Reading regression output
- 2.12Outliers, leverage and influential points
- 2.13Transforming to linearity: logs and exponential models
- 2.14Log-log transforms and power models