Page 1 of 3
Download
Get this sheet
SubscriptionOpen any sheet in any course, up to 40 a month, keys included. Or $40 month to month.
$25/mo, billed yearly
SubscribeTry one first: a free Chapter 1 worksheet (PDF, no sign-in).
What's on the worksheet
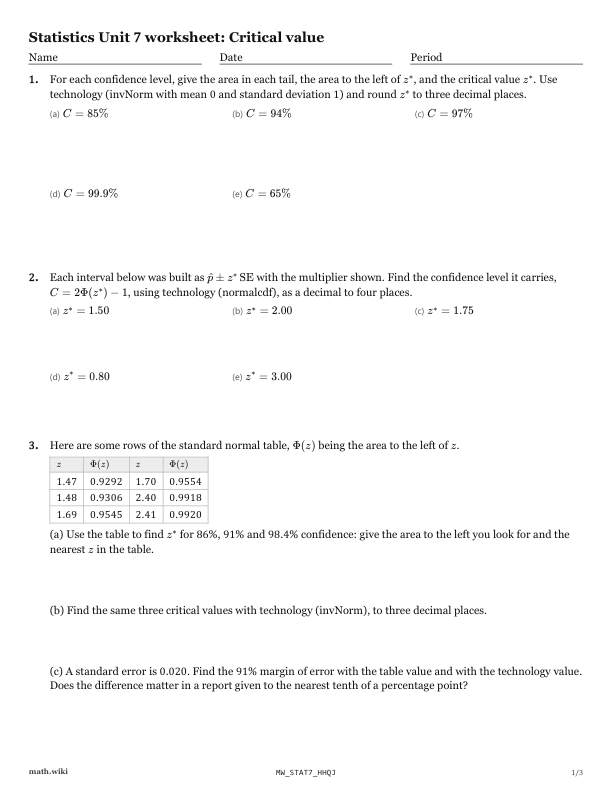
- For each confidence level, give the area in each tail, the area to the left of z^*, and the critical value z^*.C = 85\%C = 94\%C = 97\%C = 99.9\%C = 65\%
- Each interval below was built as p ± z^*\,SE with the multiplier shown.z^* = 1.50z^* = 2.00z^* = 1.75z^* = 0.80z^* = 3.00
- Here are some rows of the standard normal table, $\Phi
- A large company has about 30,000 employee accounts.
- A state biologist catches a random sample of 320 frogs in a large wetland and swabs each for a skin fungus; 72 carry it (made-up data).
- Each statement below about critical values is wrong.
Teach it first
The free lesson teaches it with worked examples and practice problems.
Critical value: the lesson ›