Page 1 of 3
Download
Get this sheet
SubscriptionOpen any sheet in any course, up to 40 a month, keys included. Or $40 month to month.
$25/mo, billed yearly
SubscribeTry one first: a free Chapter 1 worksheet (PDF, no sign-in).
What's on the worksheet
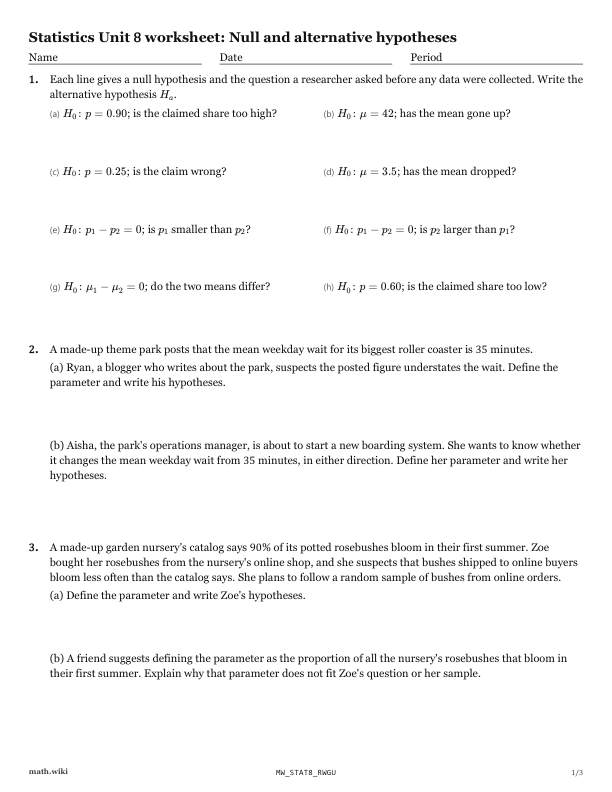
- Each line gives a null hypothesis and the question a researcher asked before any data were collected.H_0\colon p = 0.90; is the claimed share too high?H_0\colon \mu = 42; has the mean gone up?H_0\colon p = 0.25; is the claim wrong?H_0\colon \mu = 3.5; has the mean dropped?H_0\colon p_1 - p_2 = 0; is p_1 smaller than p_2?
- A made-up theme park posts that the mean weekday wait for its biggest roller coaster is 35 minutes.
- A made-up garden nursery's catalog says 90% of its potted rosebushes bloom in their first summer.
- A made-up laser tag arena owns old vests and new, lighter vests.
- A made-up pet-care magazine claims that 12% of households in a state keep a pet bird.
- A made-up tortilla factory sets its press so that the mean diameter of its tortillas is 20 centimeters.
- A made-up snow-removal company says that, after a snowfall ends, it clears its customers' driveways in a mean time of 4 hours.
Teach it first
The free lesson teaches it with worked examples and practice problems.
Null and alternative hypotheses: the lesson ›More Chapter 8 worksheets: Inference for proportions: significance tests
- 8.1Comparing two treatments by re-randomizing
- 8.2Null and alternative hypotheses
- 8.3Test statistic
- 8.4p-values and the significance level
- 8.5Deciding and concluding from a p-value
- 8.6One sample test for a proportion
- 8.7Test for a difference of proportions
- 8.8Type I and Type II errors
- 8.9Power and what raises it
- 8.10Cautions about significance