Page 1 of 3
Download
Get this sheet
SubscriptionOpen any sheet in any course, up to 40 a month, keys included. Or $40 month to month.
$25/mo, billed yearly
SubscribeTry one first: a free Chapter 1 worksheet (PDF, no sign-in).
What's on the worksheet
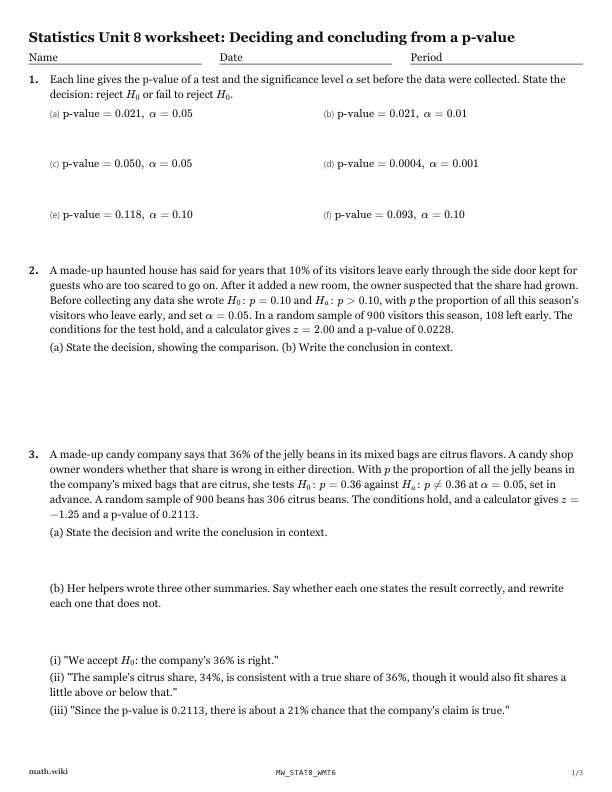
- Each line gives the p-value of a test and the significance level set before the data were collected.\text{p-value} = 0.021,\ \alpha = 0.05\text{p-value} = 0.021,\ \alpha = 0.01\text{p-value} = 0.050,\ \alpha = 0.05\text{p-value} = 0.0004,\ \alpha = 0.001\text{p-value} = 0.118,\ \alpha = 0.10
- A made-up haunted house has said for years that 10% of its visitors leave early through the side door kept for guests who are too scared to go on.
- A made-up candy company says that 36% of the jelly beans in its mixed bags are citrus flavors.
- A made-up roller rink has long said that 80% of its Saturday skaters rent skates rather than bring their own.
- A made-up thrift store sorts every donated item.
- A made-up deli found in past years that 20% of its lunch customers added a cup of soup to their order.
- A made-up drive-in movie theater has found over many summers that 10% of the cars arriving on a weeknight carry just one person.
Teach it first
The free lesson teaches it with worked examples and practice problems.
Deciding and concluding from a p-value: the lesson ›More Chapter 8 worksheets: Inference for proportions: significance tests
- 8.1Comparing two treatments by re-randomizing
- 8.2Null and alternative hypotheses
- 8.3Test statistic
- 8.4p-values and the significance level
- 8.5Deciding and concluding from a p-value
- 8.6One sample test for a proportion
- 8.7Test for a difference of proportions
- 8.8Type I and Type II errors
- 8.9Power and what raises it
- 8.10Cautions about significance