Page 1 of 2
Download
Get this sheet
SubscriptionOpen any sheet in any course, up to 40 a month, keys included. Or $40 month to month.
$25/mo, billed yearly
SubscribeTry one first: a free Chapter 1 worksheet (PDF, no sign-in).
What's on the worksheet
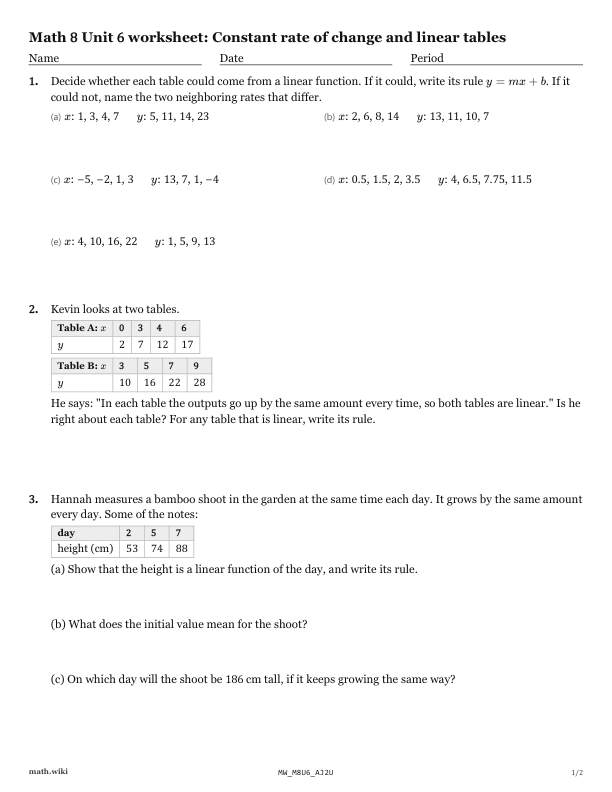
- Decide if each table could come from a linear function and write the rule:x: 1, 3, 4, 7 \quad y: 5, 11, 14, 23x: 2, 6, 8, 14 \quad y: 13, 11, 10, 7x: −5, −2, 1, 3 \quad y: 13, 7, 1, −4x: 0.5, 1.5, 2, 3.5 \quad y: 4, 6.5, 7.75, 11.5x: 4, 10, 16, 22 \quad y: 1, 5, 9, 13
- Check Kevin's claim that outputs going up by the same amount means linear.
- Word problem: the height of a bamboo shoot measured each day.
- Word problem: seats in the rows of a theater.
- Explain why Mei's different ratios of output to input do not mean the table is not linear.
Teach it first
The free lesson teaches it with worked examples and practice problems.
Constant rate of change and linear tables: the lesson ›More Chapter 6 worksheets: Functions
- 6.1Relations and functions
- 6.2Domain and range from pairs and tables
- 6.3Graphing a function from a table
- 6.4Testing graphs and equations for functions
- 6.5Evaluating a function at a number
- 6.6Reading values off a graph
- 6.7Constant rate of change and linear tables
- 6.8Reading a linear function from its graph
- 6.9Linear and nonlinear functions
- 6.10Comparing linear functions given different ways
- 6.11Graphs that tell a story