Page 1 of 5
Download
Get this sheet
SubscriptionOpen any sheet in any course, up to 40 a month, keys included. Or $40 month to month.
$25/mo, billed yearly
SubscribeTry one first: a free Chapter 1 worksheet (PDF, no sign-in).
What's on the worksheet
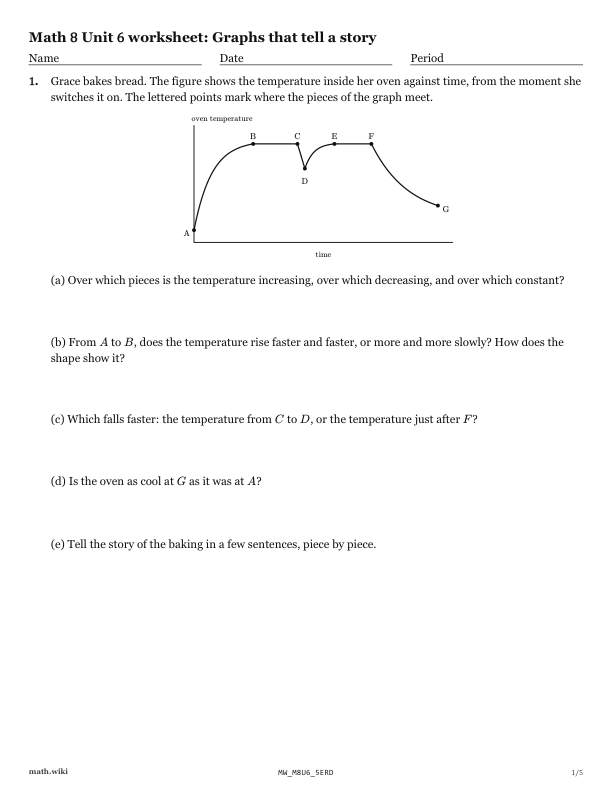
- Read the story in a graph of an oven's temperature over time.
- Match three time graphs to a bus that leaves Stop 1 and drives to Stop 2.
- Sketch a graph of Omar raising and lowering a flag.
- Read a race graph to compare Elena and Kofi.
- Sketch a graph of Jasmine climbing the stairs of a lighthouse and walking down.
- Sketch a graph of the number of bikes in a rack at Andre's school.
Teach it first
The free lesson teaches it with worked examples and practice problems.
Graphs that tell a story: the lesson ›More Chapter 6 worksheets: Functions
- 6.1Relations and functions
- 6.2Domain and range from pairs and tables
- 6.3Graphing a function from a table
- 6.4Testing graphs and equations for functions
- 6.5Evaluating a function at a number
- 6.6Reading values off a graph
- 6.7Constant rate of change and linear tables
- 6.8Reading a linear function from its graph
- 6.9Linear and nonlinear functions
- 6.10Comparing linear functions given different ways
- 6.11Graphs that tell a story