Page 1 of 3
Download, free
The full Algebra 1 courseEvery lesson in teaching order, with over 450 printables.See the course ›What's on the worksheet
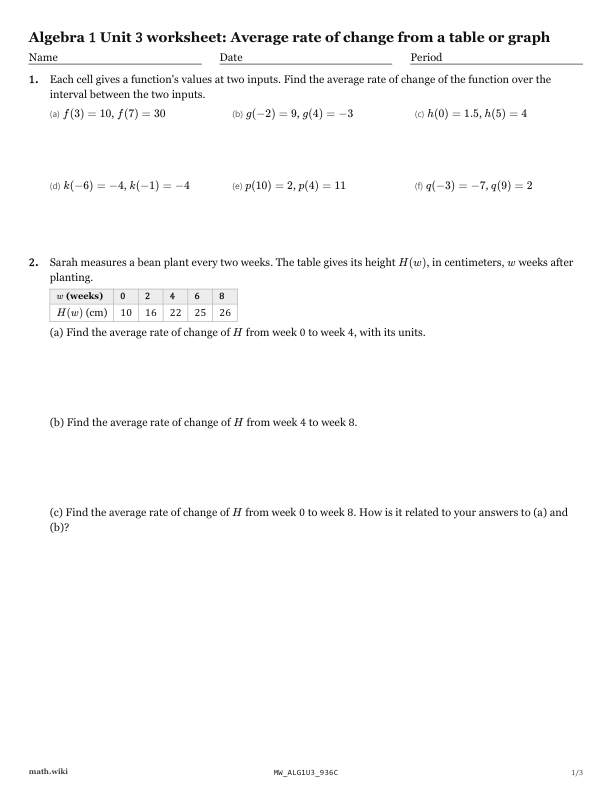
- Find the average rate of change between the two inputs given in each cell.f(3) = 10, f(7) = 30g(-2) = 9, g(4) = -3h(0) = 1.5, h(5) = 4k(-6) = -4, k(-1) = -4p(10) = 2, p(4) = 11
- Sarah's bean plant: use the height table to find average growth over intervals.
- Use the temperature table to find how fast the air temperature changed.
- Hannah's weather balloon: find the later time from the heights and average rate.
- Train problem: use average rates over two intervals to find the distance.
- Find the missing table value k from a given average rate of change.
Teach it first
The free lesson teaches it with worked examples and practice problems.
Average rate of change from a table or graph: the lesson ›More Chapter 3 worksheets: Functions: notation, domain, range, graphs and linear models
- 3.1Function notation in a real situation
- 3.2Evaluating a function at an expression
- 3.3The identity and constant functions
- 3.4Domain and range from a graph
- 3.5A reasonable domain for a real situation
- 3.6End behavior
- 3.7Average rate of change from a table or graph
- 3.8Average rate of change from a formula
- 3.9Linear functions in context
- 3.10Solving f(x) = g(x) with graphs and tables
- 3.11Point-slope form and the line through two points
- 3.12Standard form of a line
- 3.13Modeling with linear relationships