Page 1 of 2
Download
Get this sheet
SubscriptionOpen any sheet in any course, up to 40 a month, keys included. Or $40 month to month.
$25/mo, billed yearly
SubscribeTry one first: a free Chapter 1 worksheet (PDF, no sign-in).
What's on the worksheet
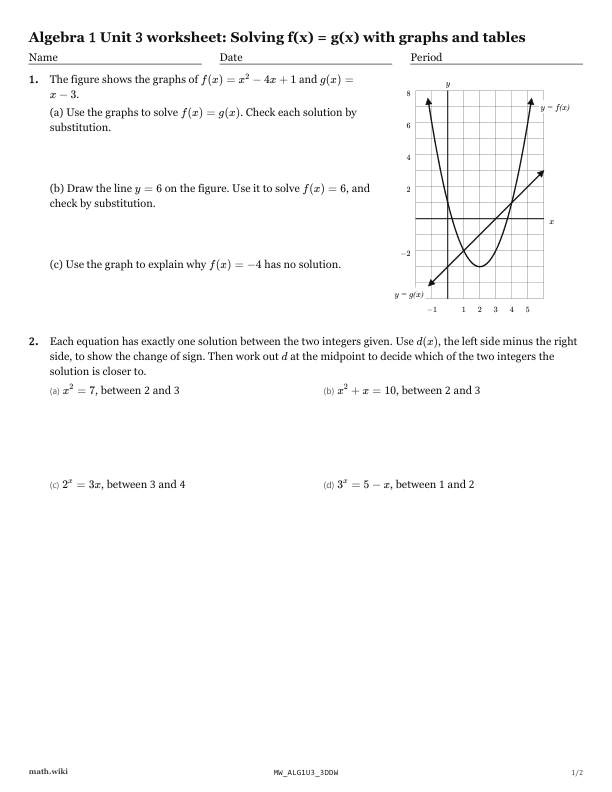
- Use the graphs of two functions to solve equations and inequalities.
- Use the left side minus the right side to show a solution lies between two integers.x^2 = 7, between 2 and 3x^2 + x = 10, between 2 and 32^x = 3x, between 3 and 43^x = 5 - x, between 1 and 2
- Find a linear function whose graph meets a parabola at two given x-values.
- Make a table of two functions, find every solution and explain why there are no others.
- Solve equations from two graphs that meet at two points, or say why the information is not enough.
- Medicine dose problem: model the amount in the blood and compare it with a limit.
Teach it first
The free lesson teaches it with worked examples and practice problems.
Solving f(x) = g(x) with graphs and tables: the lesson ›More Chapter 3 worksheets: Functions: notation, domain, range, graphs and linear models
- 3.1Function notation in a real situation
- 3.2Evaluating a function at an expression
- 3.3The identity and constant functions
- 3.4Domain and range from a graph
- 3.5A reasonable domain for a real situation
- 3.6End behavior
- 3.7Average rate of change from a table or graph
- 3.8Average rate of change from a formula
- 3.9Linear functions in context
- 3.10Solving f(x) = g(x) with graphs and tables
- 3.11Point-slope form and the line through two points
- 3.12Standard form of a line
- 3.13Modeling with linear relationships