Page 1 of 3
Download
Get this sheet
SubscriptionOpen any sheet in any course, up to 40 a month, keys included. Or $40 month to month.
$25/mo, billed yearly
SubscribeTry one first: a free Chapter 1 worksheet (PDF, no sign-in).
What's on the worksheet
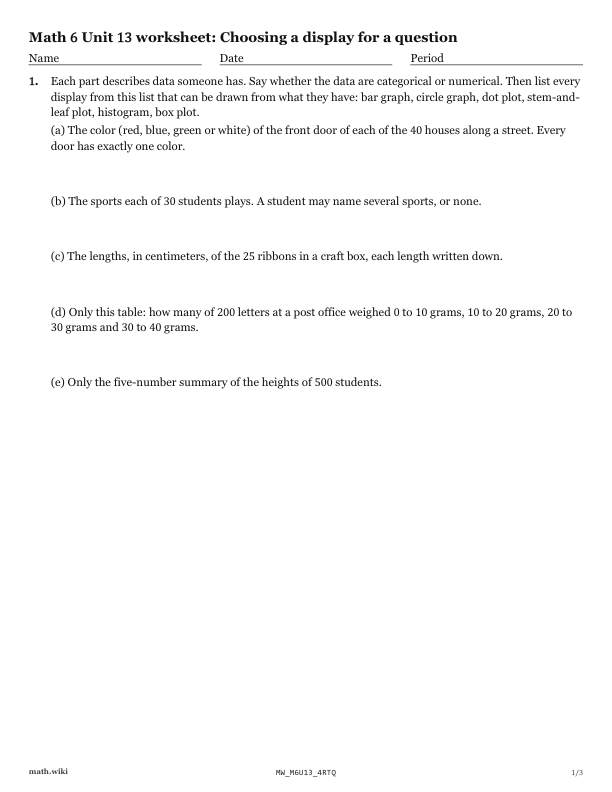
- Say whether each set of data is categorical or numerical and list the displays that fit.
- Use the box plot of teachers' commute distances to answer questions.
- Say whether each student's display choice is good, and suggest a better one if not.
- Choose displays for ruler-drop reaction data from sixth graders.
- Write 12 numbers for a histogram where the most common value is not in the tallest bar.
Teach it first
The free lesson teaches it with worked examples and practice problems.
Choosing a display for a question: the lesson ›More Chapter 13 worksheets: Dot plots, histograms and box plots
- 13.1Reading a histogram
- 13.2Making a histogram and choosing the bin width
- 13.3Stem and leaf plots
- 13.4Making and reading box plots
- 13.5Symmetric and skewed distributions
- 13.6Uniform and bimodal shapes
- 13.7Mean, median and skew: choosing the center
- 13.8Describing a distribution
- 13.9Choosing a display for a question
- 13.10Circle graphs
- 13.11Misleading graphs