Page 1 of 3
Download
Get this sheet
SubscriptionOpen any sheet in any course, up to 40 a month, keys included. Or $40 month to month.
$25/mo, billed yearly
SubscribeTry one first: a free Chapter 1 worksheet (PDF, no sign-in).
What's on the worksheet
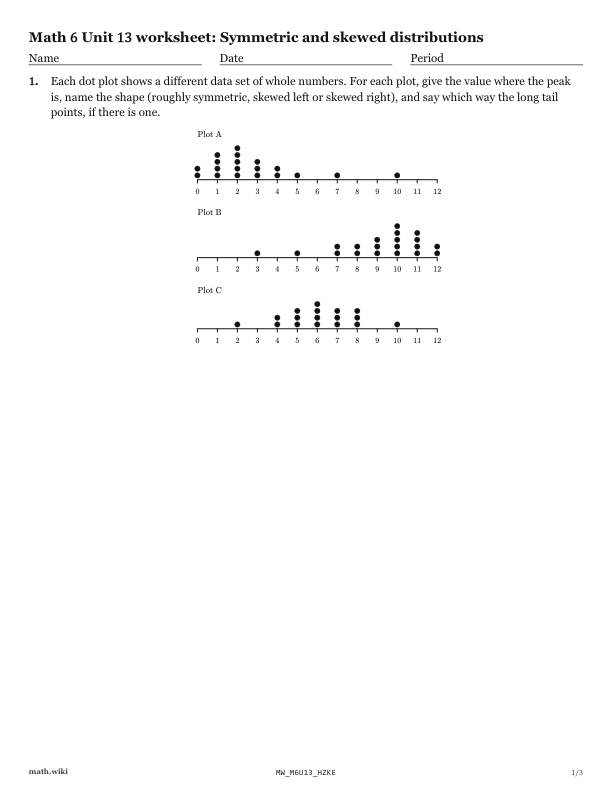
- For each dot plot, give the peak and name the shape.
- Read Arjun's histogram of dictionary search times and name its shape.
- Say whether each distribution is symmetric or skewed and give a reason.
- Read a box plot of shoppers at 15 yard sales.
- Compare paper balls in the bin when tossed from across the room and from close up.
Teach it first
The free lesson teaches it with worked examples and practice problems.
Symmetric and skewed distributions: the lesson ›More Chapter 13 worksheets: Dot plots, histograms and box plots
- 13.1Reading a histogram
- 13.2Making a histogram and choosing the bin width
- 13.3Stem and leaf plots
- 13.4Making and reading box plots
- 13.5Symmetric and skewed distributions
- 13.6Uniform and bimodal shapes
- 13.7Mean, median and skew: choosing the center
- 13.8Describing a distribution
- 13.9Choosing a display for a question
- 13.10Circle graphs
- 13.11Misleading graphs