Page 1 of 2
Download
Get this sheet
SubscriptionOpen any sheet in any course, up to 40 a month, keys included. Or $40 month to month.
$25/mo, billed yearly
SubscribeTry one first: a free Chapter 1 worksheet (PDF, no sign-in).
What's on the worksheet
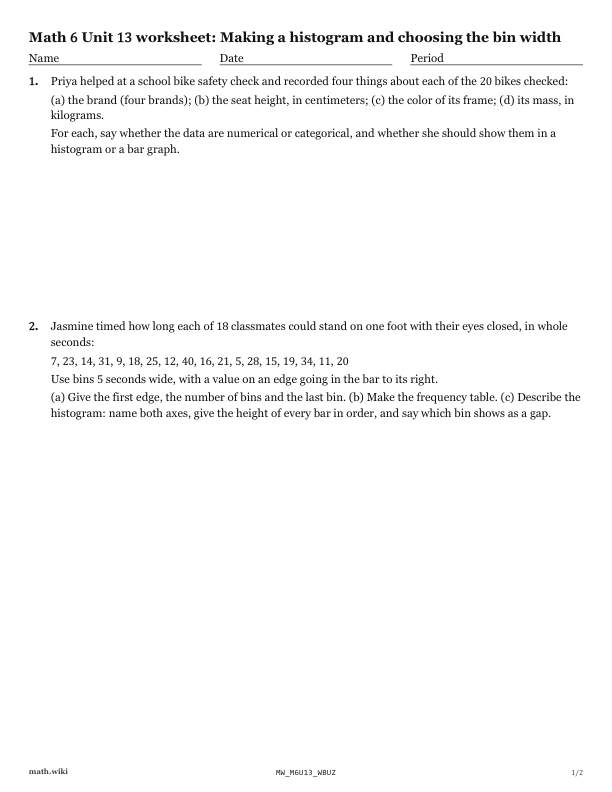
- Decide which things about the 20 bikes can be shown in a histogram.
- Make a frequency table and histogram of one-foot balancing times.
- Check Sarah's frequency table of hand spans with bins 2 cm wide.
- Check Ethan's histogram of apple weights against the lesson's method.
- Write 10 arm spans that give a histogram with stated bar heights.
Teach it first
The free lesson teaches it with worked examples and practice problems.
Making a histogram and choosing the bin width: the lesson ›More Chapter 13 worksheets: Dot plots, histograms and box plots
- 13.1Reading a histogram
- 13.2Making a histogram and choosing the bin width
- 13.3Stem and leaf plots
- 13.4Making and reading box plots
- 13.5Symmetric and skewed distributions
- 13.6Uniform and bimodal shapes
- 13.7Mean, median and skew: choosing the center
- 13.8Describing a distribution
- 13.9Choosing a display for a question
- 13.10Circle graphs
- 13.11Misleading graphs