Page 1 of 2
Download, free
The full Statistics courseEvery lesson in teaching order, with over 390 printables.See the course ›What's on the worksheet
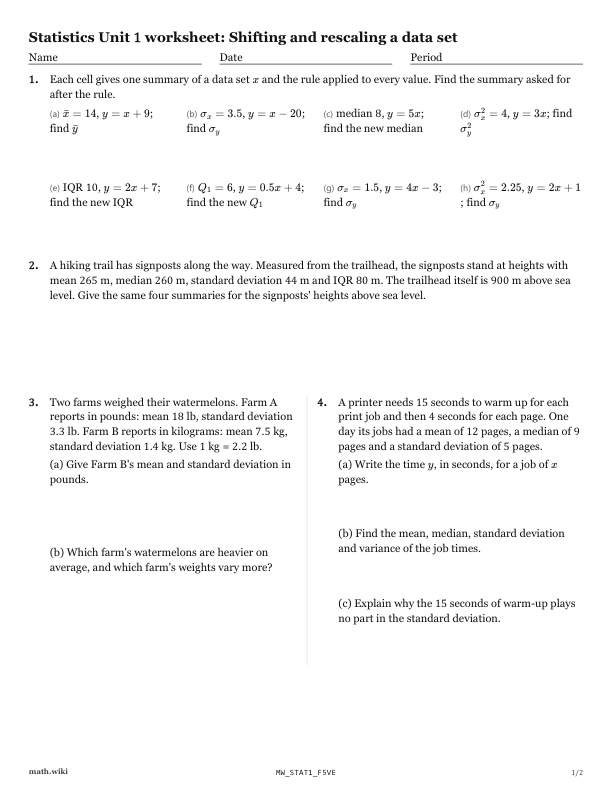
- Each cell gives one summary of a data set x and the rule applied to every value.\bar{x} = 14, y = x + 9; find \bar{y}\sigma_x = 3.5, y = x - 20; find \sigma_ymedian 8, y = 5x; find the new median\sigma_x^2 = 4, y = 3x; find \sigma_y^2IQR 10, y = 2x + 7; find the new IQR
- A hiking trail has signposts along the way.
- Two farms weighed their watermelons.
- A printer needs 15 seconds to warm up for each print job and then 4 seconds for each page.
- A tutoring center sent four families bills of 30, 35, 45 and 50 dollars.
- Samir gave a quiz marked out of 20 points.
- Malik says that every score on a test was changed by one rule y = a + bx with b > 0.
- Five bags of flour are weighed, in grams:
Teach it first
The free lesson teaches it with worked examples and practice problems.
Shifting and rescaling a data set: the lesson ›More Chapter 1 worksheets: Exploring one-variable data
- 1.1Types of data: categorical, numerical, discrete, continuous
- 1.2Making a histogram and choosing the bin width
- 1.3Describing a distribution
- 1.4Quartiles and the five number summary
- 1.5Computing a standard deviation, sample and population
- 1.6Interpreting a standard deviation
- 1.7Resistant and non resistant measures
- 1.8Box plots that show outliers
- 1.9Comparing two distributions
- 1.10Shifting and rescaling a data set
- 1.11z-scores and the empirical rule
- 1.12The normal distribution
- 1.13Normal calculations: areas and percentiles
- 1.14Cumulative frequency graphs and percentiles