Page 1 of 2
Download, free
The full Statistics courseEvery lesson in teaching order, with over 390 printables.See the course ›What's on the worksheet
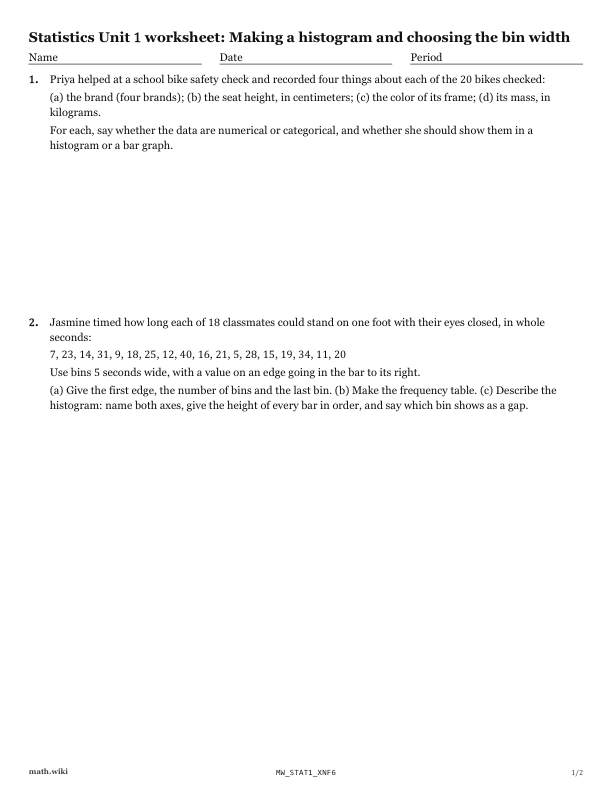
- Priya helped at a school bike safety check and recorded four things about each of the 20 bikes checked:
- Jasmine timed how long each of 18 classmates could stand on one foot with their eyes closed, in whole seconds:
- Sarah measured the hand spans of 14 students, in whole centimeters:
- Ethan weighed the 22 apples in a crate, each to the nearest gram, and drew a histogram the lesson's way:
Teach it first
The free lesson teaches it with worked examples and practice problems.
Making a histogram and choosing the bin width: the lesson ›More Chapter 1 worksheets: Exploring one-variable data
- 1.1Types of data: categorical, numerical, discrete, continuous
- 1.2Making a histogram and choosing the bin width
- 1.3Describing a distribution
- 1.4Quartiles and the five number summary
- 1.5Computing a standard deviation, sample and population
- 1.6Interpreting a standard deviation
- 1.7Resistant and non resistant measures
- 1.8Box plots that show outliers
- 1.9Comparing two distributions
- 1.10Shifting and rescaling a data set
- 1.11z-scores and the empirical rule
- 1.12The normal distribution
- 1.13Normal calculations: areas and percentiles
- 1.14Cumulative frequency graphs and percentiles