Page 1 of 3
Download, free
The full Statistics courseEvery lesson in teaching order, with over 390 printables.See the course ›What's on the worksheet
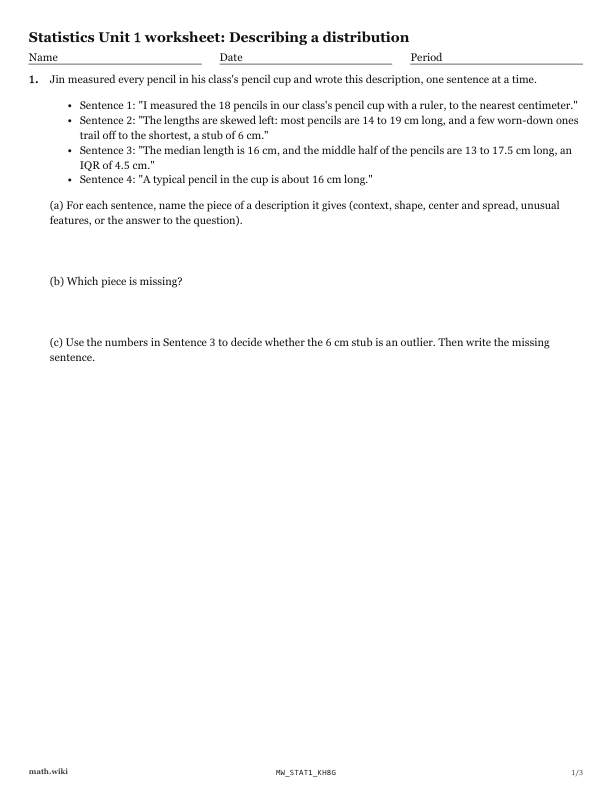
- Jin measured every pencil in his class's pencil cup and wrote this description, one sentence at a time.
- Olivia's class measured the 36 carrots in a grocery crate, to the nearest centimeter, and kept only the five-number summary:
- Mason bought a big pack of small notepads, each sold as about 20 sheets.
- Grace opened 17 fun-size bags of fruit snacks and counted the pieces in each bag.
- Leah asked the 20 students in her class how many library books each one checked out this month, and drew the dot plot.
Teach it first
The free lesson teaches it with worked examples and practice problems.
Describing a distribution: the lesson ›More Chapter 1 worksheets: Exploring one-variable data
- 1.1Types of data: categorical, numerical, discrete, continuous
- 1.2Making a histogram and choosing the bin width
- 1.3Describing a distribution
- 1.4Quartiles and the five number summary
- 1.5Computing a standard deviation, sample and population
- 1.6Interpreting a standard deviation
- 1.7Resistant and non resistant measures
- 1.8Box plots that show outliers
- 1.9Comparing two distributions
- 1.10Shifting and rescaling a data set
- 1.11z-scores and the empirical rule
- 1.12The normal distribution
- 1.13Normal calculations: areas and percentiles
- 1.14Cumulative frequency graphs and percentiles