Page 1 of 3
Download, free
The full Statistics courseEvery lesson in teaching order, with over 390 printables.See the course ›What's on the worksheet
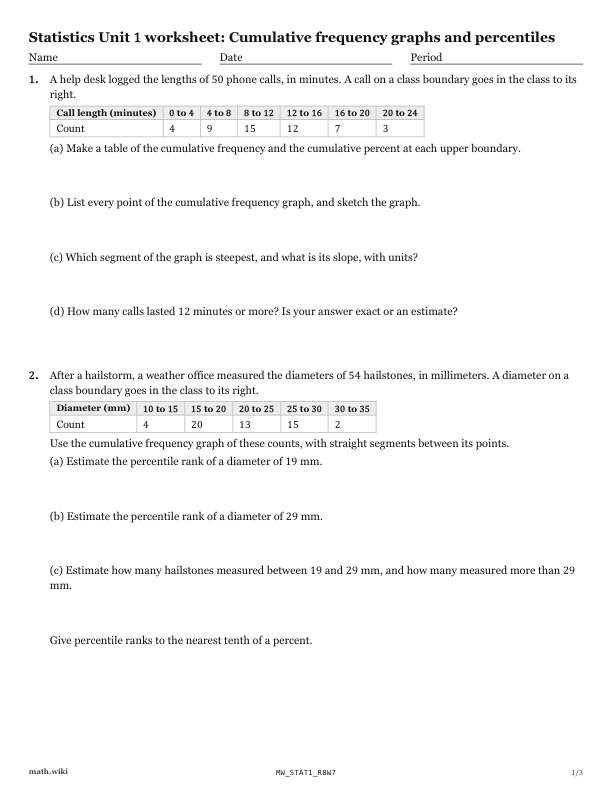
- A help desk logged the lengths of 50 phone calls, in minutes.
- After a hailstorm, a weather office measured the diameters of 54 hailstones, in millimeters.
- The finishing times of the 200 runners in a city marathon, in minutes, are grouped below.
- A forest survey measured the trunk diameters of 120 trees in one plot.
- A marathon's 200 finishing times were first grouped into six 30 minute classes from 180 to 360 minutes, with counts 12, 34, 58, 50, 30 and 16.
- Two data sets of 30 values each are both grouped into the classes 0 to 10, 10 to 20 and 20 to 30, with counts 6, 18 and 6 in each data set.
Teach it first
The free lesson teaches it with worked examples and practice problems.
Cumulative frequency graphs and percentiles: the lesson ›More Chapter 1 worksheets: Exploring one-variable data
- 1.1Types of data: categorical, numerical, discrete, continuous
- 1.2Making a histogram and choosing the bin width
- 1.3Describing a distribution
- 1.4Quartiles and the five number summary
- 1.5Computing a standard deviation, sample and population
- 1.6Interpreting a standard deviation
- 1.7Resistant and non resistant measures
- 1.8Box plots that show outliers
- 1.9Comparing two distributions
- 1.10Shifting and rescaling a data set
- 1.11z-scores and the empirical rule
- 1.12The normal distribution
- 1.13Normal calculations: areas and percentiles
- 1.14Cumulative frequency graphs and percentiles